How the Oregon draw works
A percentage goes to preference point holders, the rest is pure random giving everyone a chance.
75% of tags to highest preference point holders, 25% random.
- Most tags go to higher-point applicants, but a random share keeps opportunity open.
- Lower-point applicants still have a path in random allocations.
- Plan a long-term strategy while taking yearly random chances.
See the methodology for how odds are computed from official Oregon draw reports.
Draw odds by species
Unit-by-unit odds, points to draw, and harvest stats for every Oregon species.
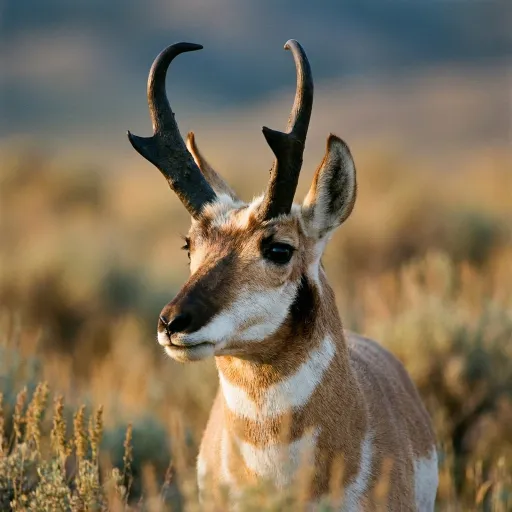
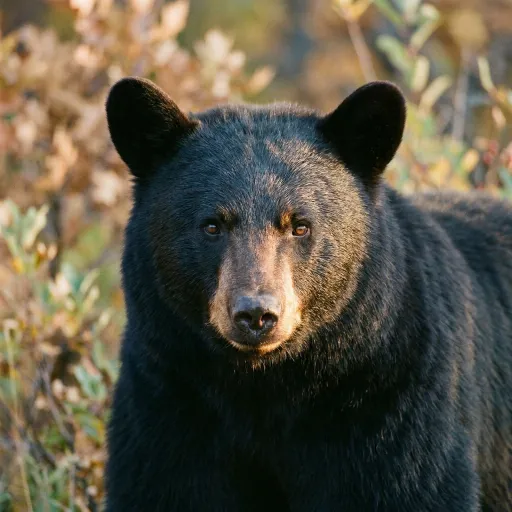
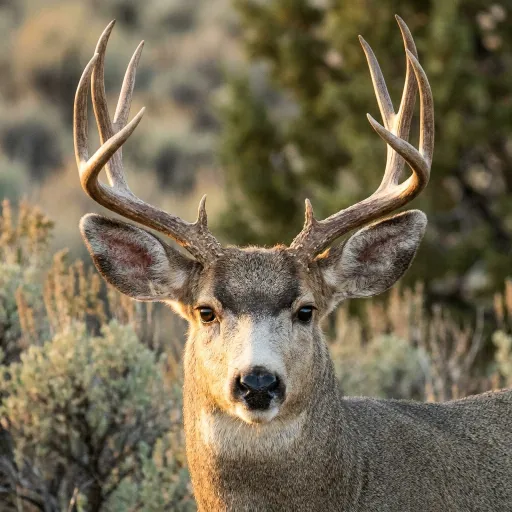
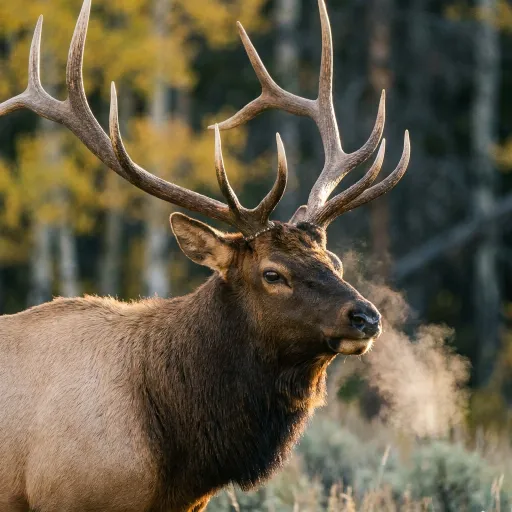
What can you draw with your points?
Hunts where the latest draw reached applicants at or below each point level.
| Species | Your points | 0 pts | 3 pts | 5 pts | 10 pts | Tops out at |
|---|---|---|---|---|---|---|
| Pronghorn | Point thresholds not published for the latest resident draw. | |||||
| Black Bear | Point thresholds not published for the latest resident draw. | |||||
| Deer | Point thresholds not published for the latest resident draw. | |||||
| Elk | Point thresholds not published for the latest resident draw. | |||||
Counts are hunt codes drawable at each point level in the most recent published draw (data 2021–2026) — thresholds move year to year, so treat them as a starting point, not a guarantee. Track your balances on your profile to fill in the “your points” column.
Oregon application deadlines
All states2027 deadlines for Oregon haven't been published yet — check the official application page. Last season's dates are the best guide until then.